Interactive Models
for Understanding Elementary
Mathematics
Introduction
The purpose of this site is to
create interactive models that can help illustrate some of the concepts and
methods of elementary mathematics. The germ of the idea for me goes back to a cross-country road trip I took with my family in 1956 when I
was eight years old. Between
stops there were seemingly interminable periods of boredom. During these
periods, I found myself watching the dashboard, specifically the odometer and
speedometer, of the car, calculating how much
progress we were making toward
our next stop and estimating when we would get there.
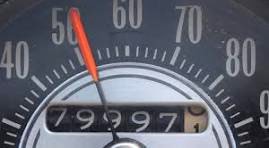
The odometer in those days consisted
of a set of wheels
marked in units of one-tenth of a mile. A unit of the next represented a single mile of
progress, the units of the next represented 10 miles of progress, and so on. As
each wheel advances at 10 times the rate of the one to
its left, so that after a complete revolution of the one (i.e., by 10 units), the other will advance by one unit, and vice versa. The odometer is thus a
visual model of the decimal numeration system, with each wheel corresponding to the place value
for a specific power of 10. In those
days, since no one imagined cars lasting for more than 100,000 miles, the
odometer only had six components, so that the left-most one corresponded to
units of 10,000. But, of course, it is easy to imagine having
arbitrarily more wheels on the left to represent larger and larger whole numbers. More interestingly, it is also easy to
imagine adding wheels to the right, even extending forever, making it possible
to represent tinier and tinier distances. It is also
able to observe the change in the odometer readings over fractional distances, like a 1/2 or 1/4 of a mile, illustrating the decimal
representation of fractions. The concept of "carrying" is naturally
illustrated by watching one or (especially) more of the readings "turn
over."
The odometer also illustrates the concepts of operators and composition. Each of the wheels in the odometer is a kind of operator which accepts input in the form
of rotation and, except for the last, in addition to a display, produces
output in the form of a modified rotation. The odometer itself
is constructed as a composition of these
operators in which the output of each operator is connected as input
to the next. For the internal wheels,
the effect of the operator is that of the fraction
one-tenth, which reduces
the input by a factor
of 10. The result of composing
the operators is to successively reduce the original input to one-tenth, one-hundredth, one-thousandth, and so
on, thus providing a visual representation of fractional multiplication.
Other topics which
can usefully be visualized in this model
include alternative bases (e.g., suppose our wheels use octal units) and the
relationship of speed, time, and distance. Now, we can't subject students to
endless hours of sitting in a car watching an
actual odometer. So, to make useful models,
we need to simplify the models and make the point of the
models more explicit without eliminating the element of discovery. So, our hope
is to carry this out for all kinds of visual interactive models and all kinds of topics.
Please send questions, comments,
bug reports and suggestions for additional topics or improvements to the
existing models to: dave.posner@elementary-math.com
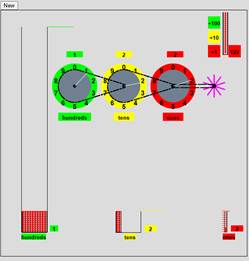
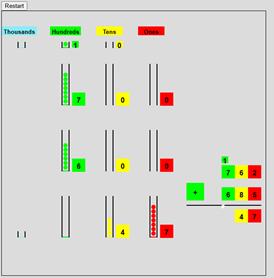
This model illustrates the concept of
“place value” using “decimal wheels”, represented as pulleys,
and as quantities of balls. Balls are
loaded from a reservoir by clicking on buttons labeled “+1”, “+10”, and “+100”. As the balls fall, they advance a paddle
wheel which drives the “ones” pulley one unit which drives the “tens”
pulley one tenth of a unit which drives the “hundreds” pulley one
hundredth of a unit. After this, the
balls fall into a tube labeled “ones”. When the tube is full of 10 balls,
the tube of balls is moved into a
box of tubes in a container labeled “tens” and when this box is full it is moved to a stack of boxes labeled “hundreds”. Counters track the total number
of balls loaded,
the current place value of each
wheel, and the number of elements in
each container. Clicking “new” in the upper left corner resets the
page.
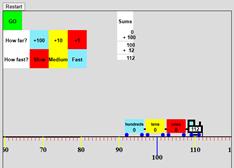
This model consists of a “railroad
track” represented as a line marked
off with unit tick marks having multiples of 10 and 100 distinguished by length
and color, a train with cars labeled “hundreds”, “tens”, and “ones” which will specify how far the train is to
travel on its next trip,
buttons for setting
the distance, a “GO” button
for starting the train,
buttons for setting the speed, and a column labeled “Sums” expressing the
total distance traveled over multiple trips as
a sequence of sums. The goal of the
model is to illustrate several
concepts including the use of position on a “number
line” to represent numbers, the use
of an intruction to change the location as an alternative model, and the
sequencing of instructions as a model of addition. The duality of representations of number is common to models of
number based on the state of a dynamic system, i.e., systems subject to change. In the first level a number is represented
as a state of the system. At the next
level number is represented as an instruction
which causes the system state to change from the 0 state to the given state. The Addition “m+n” is thus
represented as “execute m and then execute n”. For the model of number as a collection of
objects “m+n” would be represented as “add m objects” and then “add n objects.” For the train system, m+n would be
represented as “go a distance
m” and then “go a distance n.” For the counting
system “m+n” would be
represented as “count the next m numbers” and then
“count the next n numbers.”
When we discuss multiplication, we will introduce a third level
of interpretation of number: numbers as repeat operators.
Base 10 Addition:
Two
Place Addition
Three Place Addition
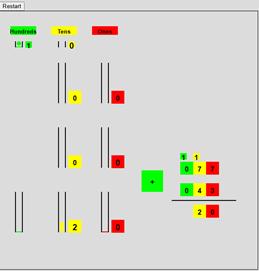
The purpose of this model is to teach and explain the base 10 addition procedure. When the models are run a random addition problem
of the corresponding size is presented in the standard form together with a
model consisting of quantities of balls, color coded by place value, for the
digits of the summands. The steps of
the procedure are carried out by clicking on
the “+” button which changes color for
the different place values. As the
digits are added the balls for the corresponding place value drop into a
collector with a counter showing the total. If
the total reaches 10, the 10 balls are replaced with a ball which is moved to a “carry”
holder for the next place value.
Base 10 Subtraction
In the model we use for
subtraction, the minuend (the top number) is represented as quantities of balls
color coded by place value as for the addition model. The subtrahend is represented as quantities
of holes organized by place value which are to be filled from the corresponding
balls above. The process of filling the
holes procedes from right to left starting with the “ones” column. Each step is effected
by clicking on the “minus” button which changes color as the hole filling is
completed for each place value. For each
placevalue the process begins with a request from the subtrahend column for the
requisite number of balls. If there are
enough balls in the corresponding minuend column, the required number of balls
are dropped down to fill the holes and the count of the remaining number of
balls is recorded in the proper place value of the result. Otherwise, a “reqrouping request” is made to
the next place value column. If the next
column has any balls, one will be removed and passed to the requesting column
where it is exchanged for 10 balls of the placevalue for the requesting column. If the next column has no balls
it makes a request to its left neighbor and so on until ultimately the requests
are satisfied and the original request is satisfied. There is also a button which displays the answer
to the problem so that students can try the problem on their own and check
their answers.
Base 10 Multiplication: 1 bt 4, 2 by 4, 3 by 4, 4 by 4
The
purpose of these programs is to teach the method of base 10 multiplication for
successively more complex problems: 1 by 4, 2 by 4,3 by 4 and 4 by 4. A random problem is generated. The student can then step theough the method
one step at a time. Alternatively, or in
addition, the student can try the problem on their own and check their answer
by clicking “Show Answer”.
Fraction Wheel
The
purpose of this application is to give students models of
fractions. When started, the student is presented with
two “wheels”: a paddle wheel pulley and a blank disk (the fraction “wheel”)
with a radial arm, connected by a compound pulley so that when the paddle wheel
is turned, the radial arm is turned coloring the sectors of the disc it sweeps
out. In addition, there are buttons labeled “1/n”, n = 2, ...,
12. When the button “1/n” is clicked, the output pulley from the
paddle wheel pulley is replaced by one n-times the radius of the paddle wheel
pulley so that n turns of the paddle wheel are required to turn the radial arm
one full turn and thus one turn of the paddle wheel colors (1/n)th of the
fraction wheel as seen in the images above for the example of “1/8”. The
endpoints of the arm for multiple turns are labeled with the corresponding
fractions, 1/n, 2/n etc. in reduced form, e.g. 0, 1/8, 1/4, 3/8, 1/2, 5/8, 3/4,
7/8. As the arm is turned, the unreduced
form of the fraction, e.g., “4/8”, is displayed on the radius to the current
fraction. The sectors are labeled with the fractional area of the
whole disk of the sector. The visual models that can be
observed are the area of the sectors (1/n) relative to the whole disk, the
fractional length of the external circle swept out (0, 1/n, 2/n,...) and
finally the compound pulley itself that drives the behavior by the 1:n ratio of
output turns to input turns. The use of the pulley in this way makes
a connection between fractions and “simple machines” which could be illustrated
by the gears and chain on a bicycle. Another
point of interest is why for certain fractions (1/2, 1/3, 1/5,1/7,1/11) there
are no changes in the reduced forms.
Fraction Wheel
Multiplication
The
purpose of this application is to give a model of fraction multiplication and
to at least hint at the meaing of multiplication in general. The
setup is the same as the simple fraction wheel model except for the addition of
a multiplication button which is initially disabled. After selecting an initial fraction pulley to
connect to the paddle wheel, the multiplication button changes color indicating
that it is enabled. After clicking it
the student is offered the chance to select a second fraction pulley to connect
to the first. The result is a double
compound pulley. In the example pictured
above, a pulley representing 1/4 is connected to a pulley representing 1/6. The initial pulley reduces each turn of the
paddle wheel by 4 and the second reduces each of the quarter-turns by six for a
net reduction of 24. Thus, the compounded
system represents the fraction 1/4 × 1/6 = 1/24. As for the simple fraction model, this model
ties in nicely with operation of mechanical devices like the pair of gearng
systems in a typical 10-speed bicycle. It
also ties in nicely with mathematical concept of “composition”. We can view a pulley as a kind of “input-output”
machine. It takes “inputs” in the form
of “turns” and produces “outputs” also in the form of “turns”. If we have two such machines
we can combine them to form a new machine by
connecting the output of one to the input of the second as shown below. More
generally if we have any two input-output machines where the output of the
first is of the same kind as the input of the second then we can form a new input-output
machine by connecting the output of the first to the input of the second. This operation is called “composition”. Multiplication is a special case of
composition!